Step 5
The Developer Tools assists in debugging your code.
- Select the "source" tab in the developer tools.

- Open the
script.jsfile.

- Place a breakpoint on line 18. (Click on the line number.)
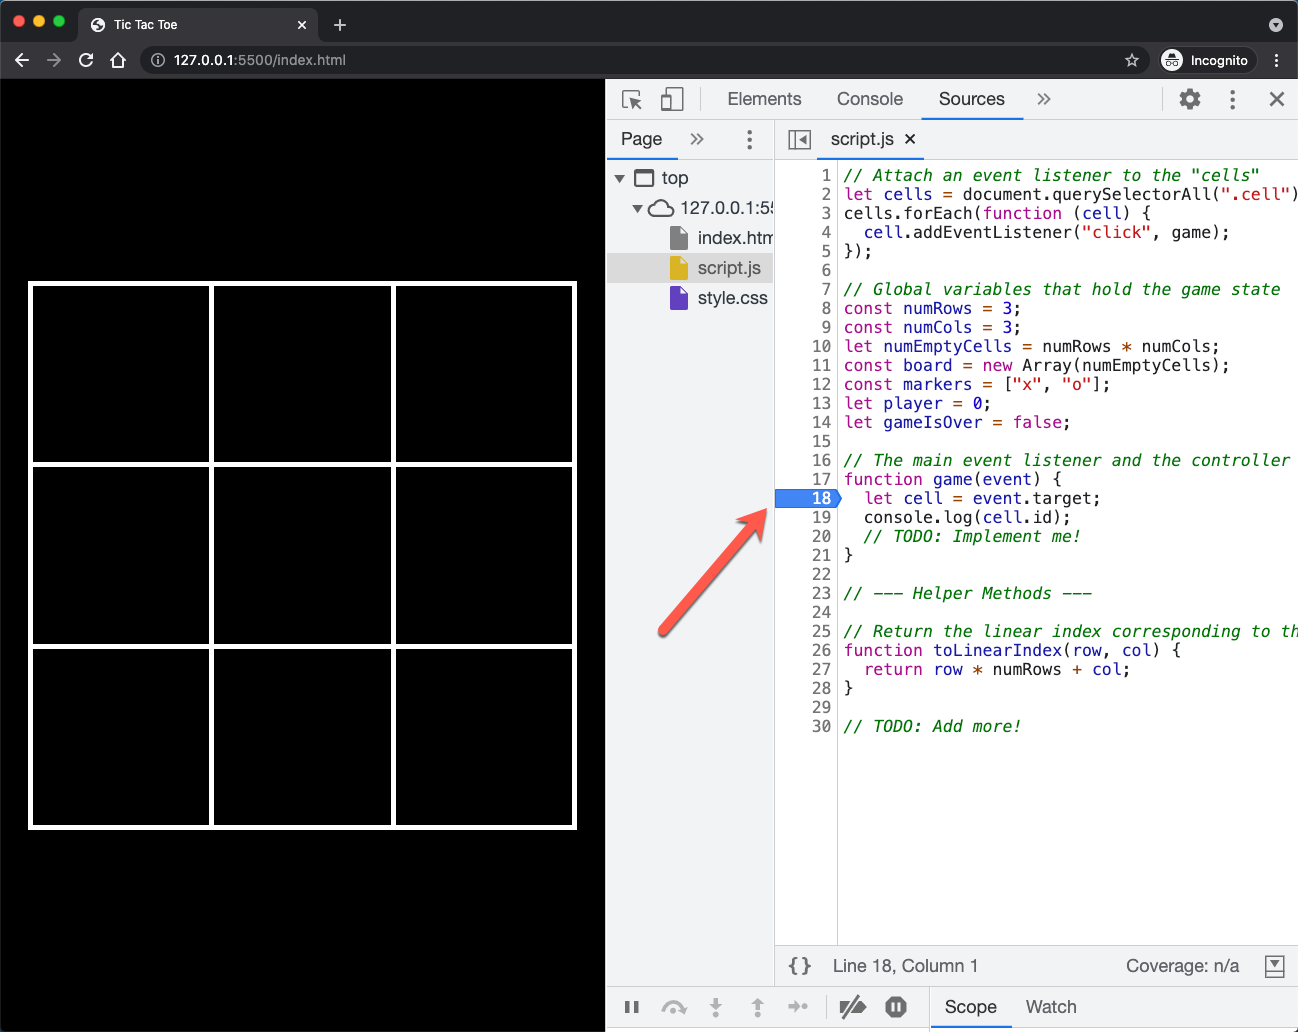
- Click on one of the cells in the game board; you must see a "paused in debugger" message appear at the top of the page.

Congratulations! You are in debugging mode. You can step over (or into) code as you have done before when debugging Java or C++ programs.
